


損益の総計を折れ線グラフで表示します。
現チャートの通貨ペアのみ表示、全体の取引から表示の2種類を選べます。
総計は金額表示の場合は、スワップ金額、手数料込みの金額になります。Pips表示の場合は、トレードによるPipsの差分のみの表示になります。
この機能は"ProfitGrap.ex4"で実装しています。

個別のトレードの損益を棒グラフで表示します。
合計、買い、売り、それぞれの金額を棒グラフ上に表示します。
現チャートの通貨ペアのみ表示、全体の取引から表示の2種類を選べます。
総計は金額表示の場合は、スワップ金額、手数料込みの金額になります。Pips表示の場合は、トレードによるPipsの差分のみの表示になります。
この機能は"ProfitBarGraph.ex4"で実装しています。

WIN:利益トレード数
LOSE:損失トレード数
ProfAve:平均利益
LossAve:平均損失
PF:プロフィットファクター
この機能は"ProfitGrap.ex4"で実装しています。

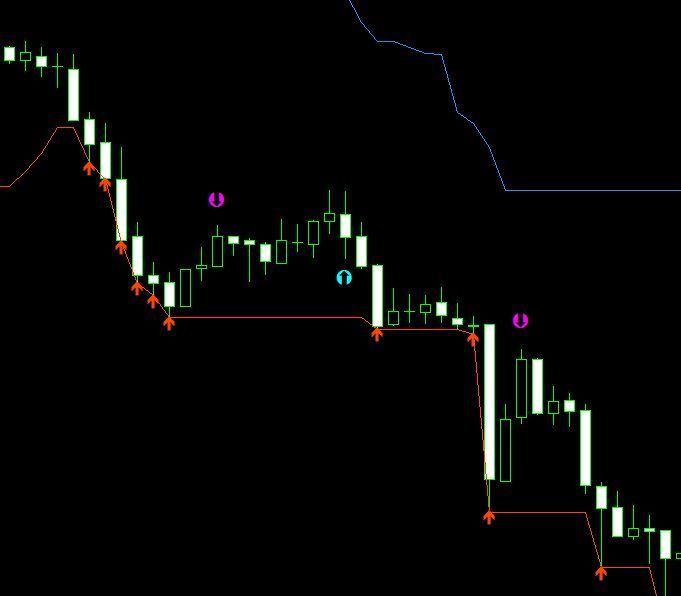
個々のトレード履歴をチャート上に表示できます。
表示、非表示を設定できます。
デフォルトでは非表示になっています。
カーソルを合わせるとツールチップで詳細を表示できます。
この機能は"ProfitBarGraph.ex4"で実装しています。

本インジケーターは"ProfitGraph.ex4"と"ProfitBarGraph.ex4"で構成されています。
①ProfitGraph.ex4をチャート上にドロップするとProfitGraphのサブウィンドウが表示されます。
②表示されたProfitGraphのサブウィンドウ上にProfitBarGraph.ex4をドロップします。
そうすると同一サブウィンドウ上にProfitGraphとProfitBarGraphが表示されるようになります。
ProfitGraph.ex4を最初にドロップすることによって、右側の縦軸メモリが総計表示になります。
先にProfitBarGraph.ex4をドロップすると右側の縦軸メモリが個別取引のメモリになります。
表示される取引履歴の期間はMT4の「口座履歴」タブで設定される期間によります。

ProfitGraph設定
「Inputs」タブ

| All Symbols | true:全通貨ペアの取引から総額を表示する。false:現チャートの通貨ペアの総額を表示する。 |
| Currency or Pips | currency:総額を金額で表示する。pips:総額をpipsで表示する。 |

ProfitBarGraph設定
「Inputs」タブ

| All Symbols | true:全通貨ペアの取引から総額を表示する。false:現チャートの通貨ペアの総額を表示する。 |
| Currency or Pips | currency:総額を金額で表示する。pips:総額をpipsで表示する。 |
| Buy Sell Sign ON/OFF | トレードのエントリー、エグジットのポジションをチャート上に表示する。 true:表示する。false:表示しない。 |
| Buy Sign color | 買いトレードの記号の色を設定。 |
| Sell Sign color | 売りトレードの記号の色を設定。 |
| Buy Line color | 買いトレードのラインの色を設定。 |
| Sell Line color | 売りトレードのラインの色を設定。 |
| Buy Sell Line width | トレード間のラインの幅を設定。 |
| Buy Sell Line style | トレード間のラインのスタイルを設定。 |

| #0 | 個別トレードの合計を表す棒グラフの色、幅を設定。 |
| #1 | 売りトレードの合計を表す棒グラフの色、幅を設定。 |
| #2 | 買いトレードの合計を表す棒グラフの色、幅を設定。 |
For those using GogoJungle for the first timeEasy 3 steps to use the product!
At GogoJungle, we provide services to enrich your investment life for our members. In addition, product purchases are normally limited to members. Why not register as a member now and make use of GogoJungle!